The origins of Tolcap go back to a university project in the 1990’s.
Many studies of the quality of a design up to that time had focused on whether it delivered the requirements - fit and function;
but this project asked the question ‘Is this design readily manufacturable?’.
Data from a variety of parts in production manufactured on various processes was gathered.
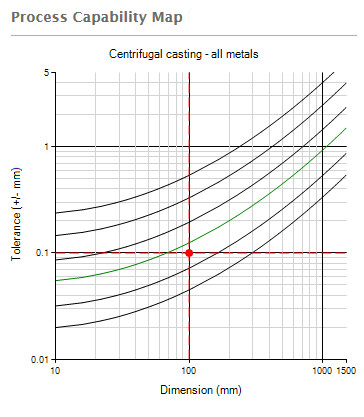
A measure of manufacturability was defined and plotted on a tolerance v dimension graph for the manufacturing processes.
Factors related to the material and geometry of the part were generated and applied to fit data from different parts to the process maps.
It emerged that the manufacturability measure correlated closely with
process capability data for the parts:
indeed Cpk could be derived from a simple mathematical transformation of the manufacturability measure.
So predicting process capability became a possibility, and that opportunity was developed to provide the web-based Tolcap product in use today.
Development included a more extensive and intensive study of parts and processes.
The data in the maps was gathered to represent good practice in the manufacturing process concerned.
We insist that the maps are empirically based on real, in process data,
but we do enhance them using information from a wider range of sources including international standards, specialist organisations,
engineering texts and experimental studies.
Particular maps may well include as many as twenty different data sources.
figure 1. A typical Tolcap Tolerance v Dimension Cpk map,
in this case for Cast Metals

Our empirical and science based approach led to testing the validity of the early maps against the new data as it was accrued.
That is not to say there were no modifications to the maps in response to this new data, but these were minor,
and the data showed that the original maps gave sound predictions - particularly in the areas of greatest interest,
that is where Cpk lies between 1.0 and 1.5.
In all cases, Tolcap data is known to be consistent with processes that are well established and fully developed.
The predicted values of Cpk have proved to have very close correlation (98%) with
SPC results.
That said, correlation measures trends, but it is individual predictions that matter.
While we don’t claim accuracy to three decimals places, we do get very close to Cpk in series production.
Our best evidence for the validity of Tolcap’s predictions is the loyalty of our customers: once signed up we lose very few as renewals come up.
We can only say that we cannot recall we have ever had any feedback from a customer that the maps gave a misleading answer on a capability
(always noting there are some suppliers out there who have specialist capabilities, hard won through experience),
and some who have told us they place great reliance on Tolcap to achieve quality and reliability goals.
We believe we compare quite well with other sources of tolerancing data -
for example the standards that tell you the tolerances to specify for various processes.
Tolcap estimates are certainly close enough to pose a meaningful question to the supplier when we predict that a particular characteristic is marginal.
Marginal? Well, if Tolcap predicts Cpk > 1.33, you can be confident your design will prove capable.
Should your supplier fail to achieve that capability in production, we would anticipate that some problem will be found in the process.
If Tolcap predicts Cpk < 1 and you can’t widen the tolerance, you are probably facing a redesign -
unless you have come upon one of those suppliers with special skills and capabilities in that niche.
The marginal cases arise when Tolcap suggests Cpk = 1.1 -ish.
This characteristic calls for discussion with your supplier.
If you ask him ‘Can you meet this tolerance?’ he will probably say ‘Yes’.
Why not? - he can meet it as well as anyone else, and if he says ‘No’ you may go to a competitor.
With Tolcap, you can say, ‘For this dimension, tolerance, process and material Tolcap predicts Cpk = 1.1. Can you achieve this?’
The point is that if he says the prediction is wrong, you can demand evidence from him to support his claim.
What similar parts has he made before?
The plausible number defining the problem leads to sensible engineering discussions and evaluation of evidence.
Predicting process capability is an essential part of design.
What is a design? A design is an instruction and a contract.
For each part in the design there is a drawing, and that drawing instructs the supplier what is to be produced.
Then, if the part conforms to the drawing, the supplier will have fulfilled his contract –
no one further up the supply chain right through to the customer will be able to say ‘It doesn't work’
or ‘It doesn't fit’.
Once this definition of the design is accepted,
the rather daunting consequence is that it is down to the designer to ensure that the contract is feasible,
and the instruction is capable.
Tolcap enables the designer to predict process capability,
rather than find manufacturability problems emerge only after the start of full production,
when problems in assembly or of dimensions out of tolerance then have to be addressed.
Written by:

Richard Batchelor MA, MBA, CEng, FIEE
Richard is a founding member of the Capra Technology team.