This article is an update of a paper (
Counting the Cost of Quality
) published in the Sept/Oct 2010 edition of the
‘Engineering Designer’ (‘ED’), the journal of the Institution of Engineering Designers.
The paper pre-dates Tolcap, and was illustrated from
‘TCE’ the server-based forerunner of Tolcap.
This article presents the same arguments as its predecessor, but the has been updated with screen shots from Tolcap (
www.tolcap.com )
How often have you been in a meeting to be told about a ‘cost reduction’ and groaned? You know what I mean – often it’s the
purchasing guy (and all he’s doing is chasing the material cost saving targets he’s been given) – but he’s discussed your
component with the supplier and they’re both quite sure they don’t have to do that operation that adds so much to the cost.
You just know the operation is essential. You tell them we tried doing without it a few years back and it didn’t work. Ah,
but technology moves so quickly doesn’t it? And why are you standing in the way of a 5% cost saving? Because we have to
stay competitive, or there just won’t be a job designing this stuff any more. And it’s up to you in engineering to solve
any little problems along the way, and to just make sure the drawings spell out what we want.
The problem is that you are arguing from your considerable engineering experience, but where’s your measure and target for
that? And even if you had one, any metric you have won’t stand against the hard ‘fact’ of a 5% cost reduction –
it sounds even better in pence or cents too. So the only way you can fight back is with an alternative cost figure – one
that includes the cost of quality – here meaning the cost of putting things right when they all go horribly wrong. If you
can estimate the quality cost of the existing design and the new proposal, it could well be that an apparent 5% saving is
more likely to be a 15% on cost!
But how can an engineer argue the cost with the commercial people? What do we know about quality costs? They allow for that
somehow in the overheads don’t they? Well, yes they do, but let’s take a look at that ‘somehow’. It is not that
hard to get a list of all the material that has been signed off as scrap and work out how much it cost. It’s a little
more difficult to capture the time spent re-working parts and re-testing them, but that can be done to find a cost of
rework. But then what happens is that the total is averaged out over assembly time, or some other basis for overheads,
and these costs are just shared out, so we are told that scrap and rework are 2% of assembly cost, say. More sophisticated
organisations will recognise their quality department as elements of a higher quality cost, but few will even want to
consider all that overspend in engineering as quality cost. Surprising isn’t it how they forget that while you were sorting
out that production issue last year you weren’t actually getting much done on your own project?
The flaw in the costing algorithm is that step of averaging quality costs. It works for allocating overheads, but a
moment’s thought shows it is no use at all for individual parts and day-to-day decisions about them. Just think about
the different parts in your organisation: some of them will sail through with never an issue, and the quality engineers
will probably hardly recognise them, whereas other parts will be all too familiar, because they are ongoing problems
week-in, week-out. So quality cost is not something uniform to be averaged – it sticks to some parts in very large lumps!
An answer to this problem emerged while I was working in two areas trying to predict process capability. In Six Sigma,
particularly in Design for Six Sigma (DFSS) the idea is to predict the capability of the final product. In working towards
the development of CapraTechnology’s Tolcap software, we were trying to predict the process capability of parts. This method
was described in my article in the
Jan/Feb 2010 issue of Engineering Designer
(Ref 1).
In both these cases, if we can predict
process capability,
then, maybe we have to assume a distribution, but we can
calculate failure rate, failure probability, even the ‘Occurrence’ rating of the defect for
FMEA, if we want.
The link to FMEA started a train of thought. It should be possible to make a
small adjustment to the FMEA ‘Severity’
scale, to reflect the traditional ‘rule of ten’ for failure costs (figure 1).
- Component failure (found before/ at first assembly stage)
- Failure in subassembly
- Failure at final assembly
- Scrap unit or customer reject (OE return)
- Warranty return
- Warranty return, consequential damage
- Breach of statutory or regulatory requirements
- Potentially hazardous failure
- Hazardous failure - some control possible
- Serious hazardous failure - no control
Figure 1: Impact (severity)
This ‘rule of ten’ states that when a defect is discovered, then its cost increases tenfold for each stage
of the process it has gone through. Some examples illustrate the credibility of this theory:
As a baseline, if a product is sent straight back by the customer (sometimes called an ‘OE return’), then
supplying a replacement plus all the associated administration roughly equates in cost to the sales revenue for the product.
If the product has got into the field and then fails, then the warranty cost is ten times as much as for the instant return,
given shipping costs and investigation into causes etc. Moving back through the process, reworking a product found to be
defective just before it is despatched might well incur a cost of 10% of the value of the product.
Taking a 1% probability of an OE return as an example, we can plot a graph of the occurrence versus the severity. Using a
log-log scale means it is easy to plot sloping ‘isocost’ lines on the graph. Reading the isocost line confirms
that the quality cost of this problem is 1% of sales (figure 2).
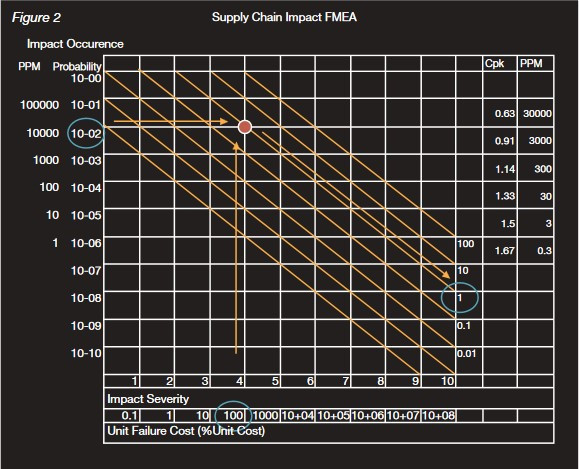 Figure 2: Supply Chain Impact FMEA
So if 1% of units were OE returns, quality cost would be 1% of sales.
Taking another example, consider a different fault:
Its occurrence is one hundred times less probable but it will result in a later warranty problem rather than an immediate
OE return. Each fault will cost ten times as much (figure 3).
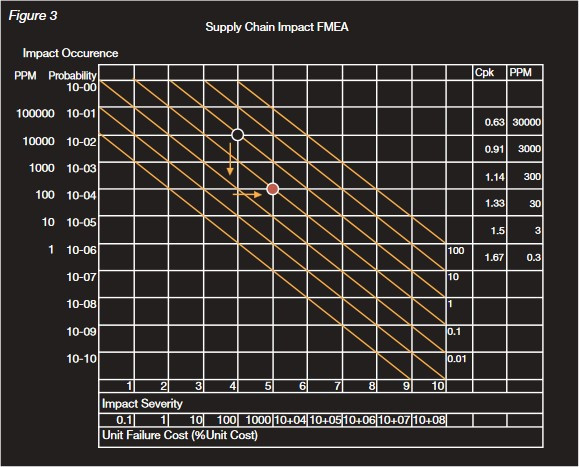 Figure 3: Supply Chain Impact FMEA
But the importance of process capability prediction extends beyond the design department to the whole company: well it would do since
it is design that has by far the greatest influence on product costs. Studies show that nearly half of the problems encountered
in production are to do with design for manufacture or production variability - that is process capability problems.
The costs of the problem can be very high - consider the problem above and the costs involved - not just the rework or
remanufacture of samples, but also the time and effort of quality engineers and designers, who should be completing the design
of the current product and getting on with the next generation. In our training we suggest these costs may run to 20% of sales,
and we believe they can be even higher - hence the title of this article!
So compared with the previous example, the quality cost of this problem is ten times less (0.1% of sales). We can readily
plot any fault on the graph and read its effect on quality cost. Now these costs are not offered as accurate to three places
of decimals, but if the figure is to be challenged, then data to support a better figure is needed, and the organisation is on
a course to evaluate design alternatives more rationally. Do note, by the way, that this cost model represents only the
monetary losses; it does not allow for potentially ruinous damage to the supplier’s reputation, or brand image.
The points in the examples are towards the top left of the graph, but what about the bottom right hand corner? It is difficult
to put a cost on high severity failures, breach of statutory requirements or product liability cases. Enquiries of insurance
cover requirements for various potential liabilities directed the impact severity scale. The isocost lines verify that we need
extremely low probabilities of failure, way below the FMEA scale. A moment’s practical engineering thought discards the
possibility of a single design characteristic with such a low failure rate: even if it were achievable, how could it be
demonstrated to be that capable? But, calling on reliability design principles, suppose we have a redundant design with two,
independent characteristics guarding against a failure mode, then we can multiply the two failure rates to get the failure
rate of the combination. If two characteristics each have 30 PPM (parts per million) failure rates, the probability that
both will fail is one in a billion (1 in 10-9).
Case study
The final step in the assembly of a product selling for £100 is to fix a lid on the cast case with eight 4mm self-tapping screws.
It is suggested we save 4p by having the screw holes cast in, instead of having them drilled in a separate operation.
The data sheet for the screws (figure 4) suggests a tapered core hole, diameter 3.75 + 0.05, -0. Interestingly the H11
tolerance for a drilled hole is +0.075, -0, which is more generous!
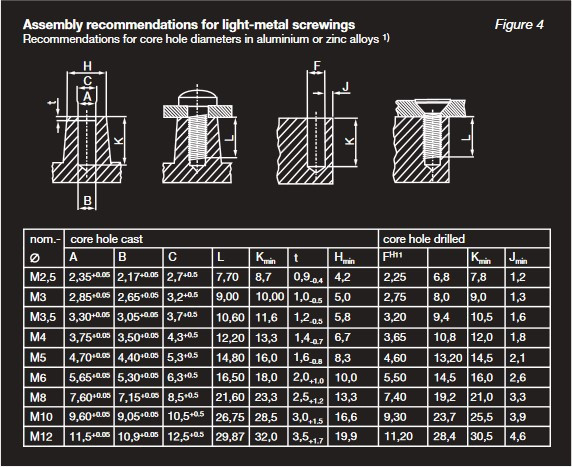 Figure 4: Assembly recommendations for light-metal screwings
We put 3.75 +0.05 on the drawing, but let’s assume we can get away with +0.075 as for drilling.
Using CapraTechnology’s Tolcap software, as described in
Ref. 1,
this is capable tolerance for drilling (Cpk = 1.7) - figure 5.1:
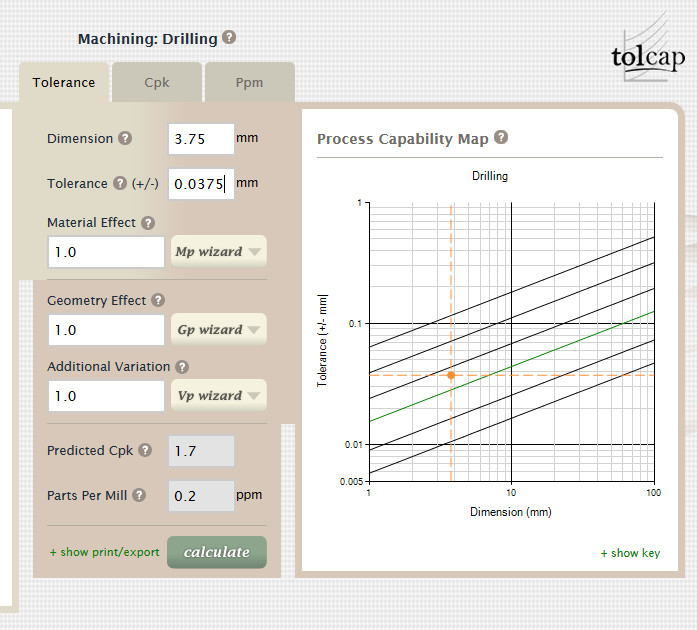 Figure 5.1: Machining - Drilling
but casting is Cpk = 0.96 - figure 5.2:
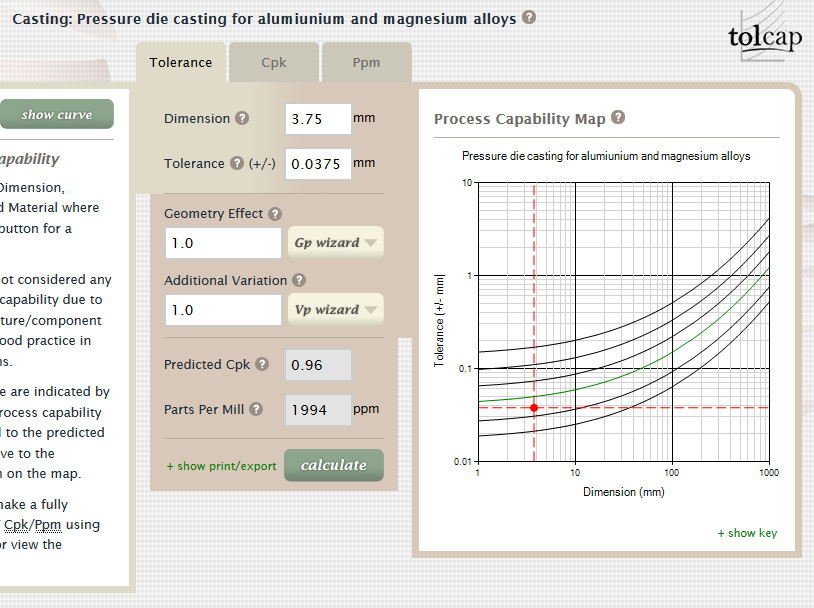 Figure 5.2: Pressure Die Casting - Aluminium and Magnesium Alloys
and that’s 1994 PPM out of tolerance for each screw. With eight screws, that means 20,000
PPM or 2%. Assume 10,000 PPM are too big and 10,000 PPM too small.
If the holes are too small, screws shear in 1/100 assemblies when they are driven in (we can allow for this by dropping the
occurrence two squares on the graph). This is the last operation, and we lose virtually the whole value of the product. If
the holes are too big, a screw will work loose and 1/100 products will leak and be returned under warranty. The graph
(figure 6) shows the costs are £0.01 + £0.10 = 11p – at best, but remember Murphy’s Law, and we might get more
loose screws than we thought!
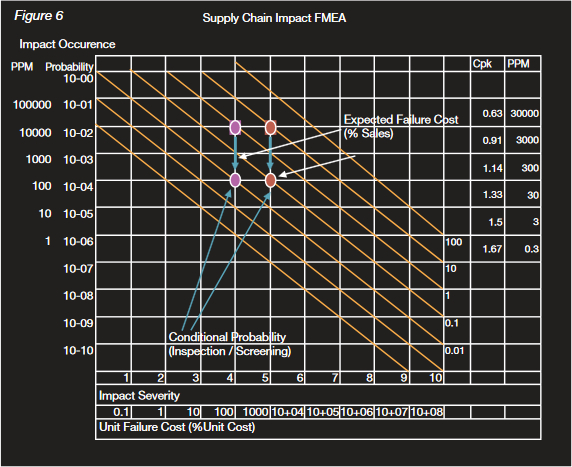 Figure 6: Supply Chain Impact FMEA
So we save 4p by not drilling. However, the question for the organisation is: who pays the 11p quality cost?
In conclusion, cost of quality is important in understanding total cost, and therefore in choosing the better design alternative.
If we can predict process capability (as Ref. 1)
and assess the impact of being out of tolerance then we can estimate a quality
cost. Then alternative designs and processes can be compared directly on a total cost basis, and we can have better discussions
with our colleagues and our suppliers.
References
Batchelor, R ,Design for Process Capable Tolerances, Engineering Designer, January/February 2010
Batchelor, R, and Swift, K G, (1996), Conformability analysis in support of design for quality, Proc. IMechE, Part B, 2 0, pp37-47.
Batchelor R, and Swift KG, Capable Design, Manufacturing Engineer, December 1999.
Back to the resources